
By any measure, 2020 was an extraordinary year and who could have predicted the events that unfolded.
The fact is that shocks to the system, and to the financial markets, are more commonplace than we give them credit for.
Less common by far, is the ability to anticipate, time, and benefit from these sudden moves. That doesn’t prevent people from trying by telling you, either repeatedly ad nauseum (the so-called ‘Perma-bear’) until eventually, inevitably, they get one right, or else in hindsight, with condescending phrases such as ‘all of the tell-tale signs were there’. No-one ever seems to consider that perhaps these people have skin in the game.
Perhaps, just perhaps, they need you to believe that active management can routinely and consistently time market entry and exit, and in doing so persistently outperform the market as a whole.
Perhaps, just perhaps, that’s how they can justify their annual management fees? “Sure we have higher management fees, but we do more for it, and you more than make up for it in increased performance.”
Thank you to our investment managers, EBI for the following article where they reflect on 2020 in their own unique style and importantly include the following observation and lesson for investors.
2020 – A Year In Review 
While often mistakenly attributed as being an ancient Chinese curse, the deeply ironic sentiment expressed above is actually a whole lot more recent in origin, first being documented in 1936 (in the Yorkshire Post, no less), although that first mention does allude to it being an old Chinese saying. There is little argument, however, that it could surely have found no better or more fitting home than the year 2020.
In any given year, the task of sitting and condensing a year’s worth of undulations in the equity, bond, commodity and currency markets, and parsing through the myriad crosswinds of socio-political and macroeconomic forces that played out during the period, is an arduous task. In 2020, it became truly Herculean. A year ago, and yet somehow psychologically about a hundred years ago, we ushered in 2020 with concerns over an escalating tit-for-tat trade war between the United States and China. It was a clash of cultures, a clash of styles, a clash of personalities: In the red corner, Xi Jinping, the pragmatic, low-key, down-to-earth party man, seemingly uninterested in the trappings of high office, and in the blue corner, Donald John Trump, the self-aggrandizing, narcissistic individualist, seemingly uninterested in anything other than the trappings of high office.
It was a heavyweight battle for the ages – Xi versus Anti-Xi. Trump threw the first punch, a thinly disguised xenophobic jab, ostensibly intended to place tariffs on solar panels, aluminium and steel from ‘all nations’, but there was no mistaking upon whose jaw that punch was intended to land. And land it did. Xi responded by dropping the pretence and slapping tariffs of between 15% and 25% on some $3 billion in US goods. A miniscule amount in the grand scheme of things, but the point was made.
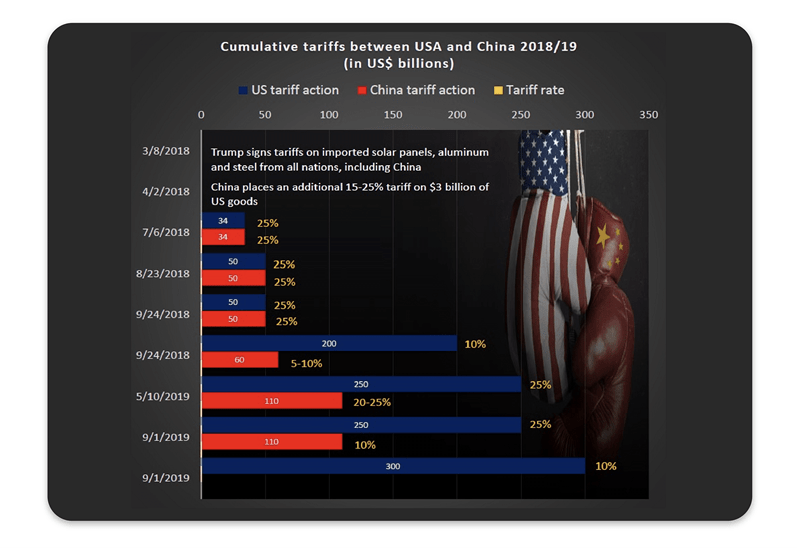
Thus began a marquee bout of political pugilism. Xi fired up the party’s media megaphone, the Xinhua News Agency, to weave its time-tested propaganda tapestry within China, while Trump, bemoaning the fact that he doesn’t have a state-controlled media apparatus to promote his message, stuck to the American expression of ‘you gotta dance with the one that brung you’, and turned to social media to spread his woefully misguided message on how tariffs actually work (whether deliberately or through ignorance) by continually claiming that he was somehow collecting that money from China, instead of China exporting us usual, the US raising the prices charged to US importers to cover the tariffs, and those same US importers then passing the price hike down the line all the way to the consumer.
Undeterred by pesky irrelevances such as facts, the self-anointed ‘Hemingway of 140 Characters’ continued his Twitter assault of all things Sino all the way into early 2020. Of course, this was back when he actually HAD a Twitter account. As I write this, we are approaching the waning hours of the Trump presidency, with Twitter having finally decided to confiscate his crack pipe, while Congress has bestowed upon him the ignominy of being the only President to ever be impeached twice. One suspects he has spent his evenings since the armed insurrection on the nation’s Capitol in a red MAGA hat and black hoodie wandering the alleyways of Dupont Circle, trying to sell nuclear launch codes for a bag of tweets, leaving the world to marvel at the levels of ineptitude required to get fired from your job while in the process of being fired from your job.
Little did we know, as we watched the markets digest a war of trade and words by the world’s two largest economies, played out to a ravenous media, that not too far away from Beijing, in a province known only to a select few westerners at the start of the year, a far more catastrophic and malignant threat to growth, prosperity, and above all health, was ready to engulf the world.
Imagine an investor falling asleep after ringing in 2020, and staying asleep until the very last throes of the year. You sit down with this Rip-van-Winkle of investment and you tell them they missed a whole lot: a global pandemic has ravaged the entire world, and is currently at its deadliest levels, while economic growth has shrunk by some 4.4% globally, and 9.8% in the UK, the US election is still being contested as the ball drops in an empty Times Square, while Santa Claus arrived before a Brexit agreement did.
You then calmly inform them that the last time they reviewed their portfolio they were happy being fully invested, and so you kept them that way throughout the year. Assuming that they (and you, once you’ve told them!) survive that bombshell and proceed to review their portfolio again, how likely do you think it is that this investor expects to see black ink?
While undoubtedly an ‘annus horribilis’ by almost any objective measure one could think of on a personal level, 2020 ultimately proved to be a year of vindication, indeed reinforcement, for the long-term, buy-and-hold passive investment strategy that EBI champions.
Economic expansions don’t die of old age. They don’t wither. Don’t peter out. Don’t gently slip away on the front porch in their favourite chair, as the soothing rays of the afternoon sun dance across their face. Economic expansions suffer blows; enormous exogenous shocks that blindside them, and send them reeling. Blows of such magnitude that they are brought to their knees. As the saying goes, though: it’s not about how many times you get knocked down. It’s about how many times you get back up.
More than that, it’s about how you get back up.
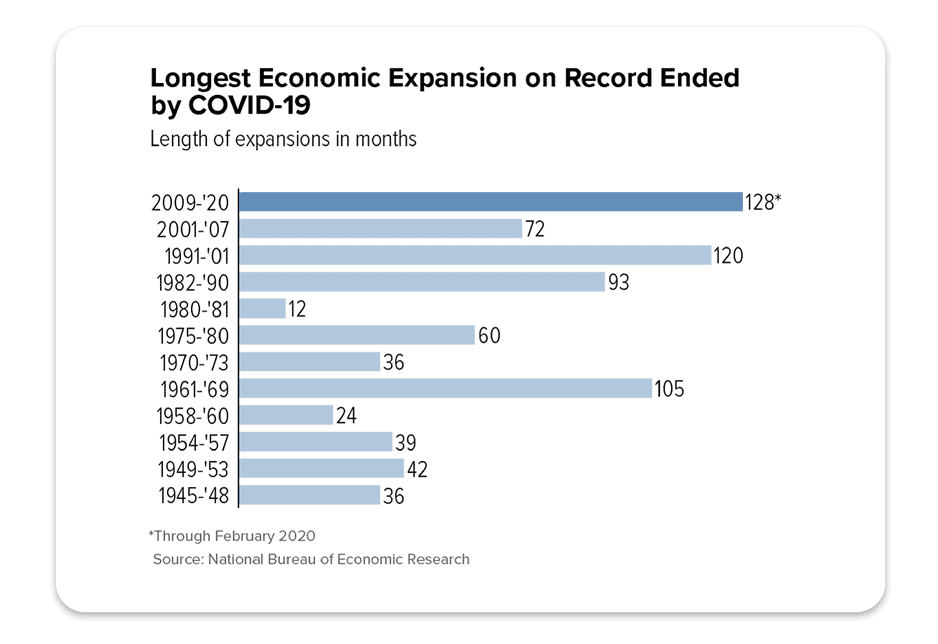
As the above example of the United States shows, economic expansions are invariably multi-year affairs, with the most recent one stretching back over ten and a half years. It began in the aftermath of the financial crisis, and only ended when it suddenly succumbed to COVID-19 in March. The enormous, exogenous shock strikes again. The outlier event. The ‘100 year storm’. Yet, whenever we encounter one of these 100-year storms (of which this will be our third in less than 20 years – 9/11, financial crisis, coronavirus), we tell ourselves that this one is different. We bandy around phrases like ‘new paradigm’ and ‘new normal’, oblivious to the fact that too many ‘new normals’ mean that ‘normal’ itself no longer exists.
The fact is that shocks to the system, and to the financial markets, are more commonplace than we give them credit for. Less common – by far – is the ability to anticipate, time, and benefit from these sudden moves. That doesn’t prevent people from trying by telling you, either repeatedly ad nauseum (the so-called ‘Perma-bear’) until eventually, inevitably, they get one right, or else in hindsight, with condescending phrases such as ‘all of the tell-tale signs were there’. No-one ever seems to consider that perhaps these people have skin in the game. Perhaps, just perhaps, they need you to believe that active management can routinely and consistently time market entry and exit, and in doing so persistently outperform the market as a whole. Perhaps, just perhaps, that’s how they can justify their annual management fees? “Sure we have higher management fees, but we do more for it, and you more than make up for it in increased performance.”
Can they ever successfully time market entry and exit to outperform? Of course! Some do – once, twice, maybe a handful of times. Many more don’t though, and the ones who do never seem to do so with enough consistency to justify the added fees they take from your pot – the consistency of which you can set your watch by.
The following chart shows performance of our Global 60 Portfolio, which is our most prevalent. It is charted against a comparable private client index (in this case the ARC Steady Growth developed by Asset Risk Consultants, Limited; most users of our site are familiar with this from our factsheets). We chose this for comparison purposes as it a measure of the DFM market, and as such is primarily composed of active managers. Also shown is a composite we created of 60% MSCI ACWI (the equity portion) and 40% FTSE WGBI (the bond component), rebalanced annually at year end. The time period is, by necessity, from the start of 2004, as that is the longest period of common history for the series.
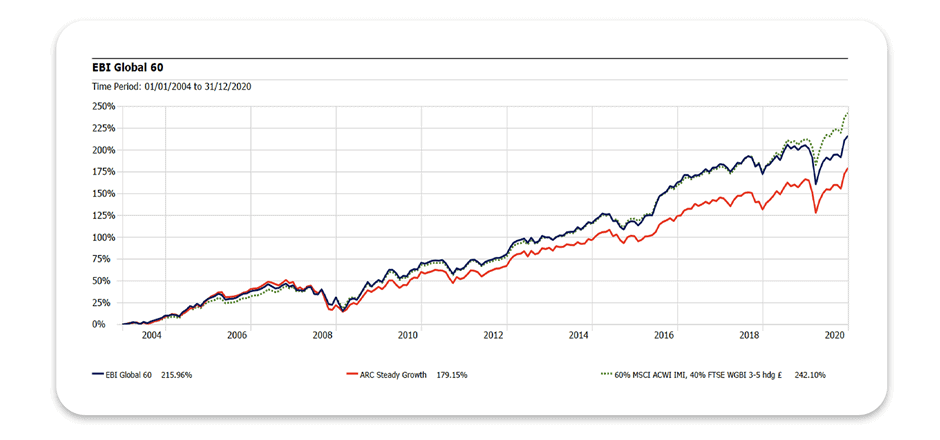
You can see that the EBI Global 60 has outperformed the ARC index for the period, but has underperformed the benchmark we created, which tells us primarily that, while EBIs fees are incredibly low, they’re not zero, which the index is. It also tells us that over longer time frames, assets of this nature (stock, bonds) appreciate in price – but we all know that already. That doesn’t detract, however, from just how scary it is to ride out those market shocks when they do come around. As with any fear, though, a better understanding lessens its ability to scare us.
Below is a table of EBI Global 60 portfolio showing a list of all drawdowns of magnitude 10% or greater going as far back as our data will allow (1956; 65 years):
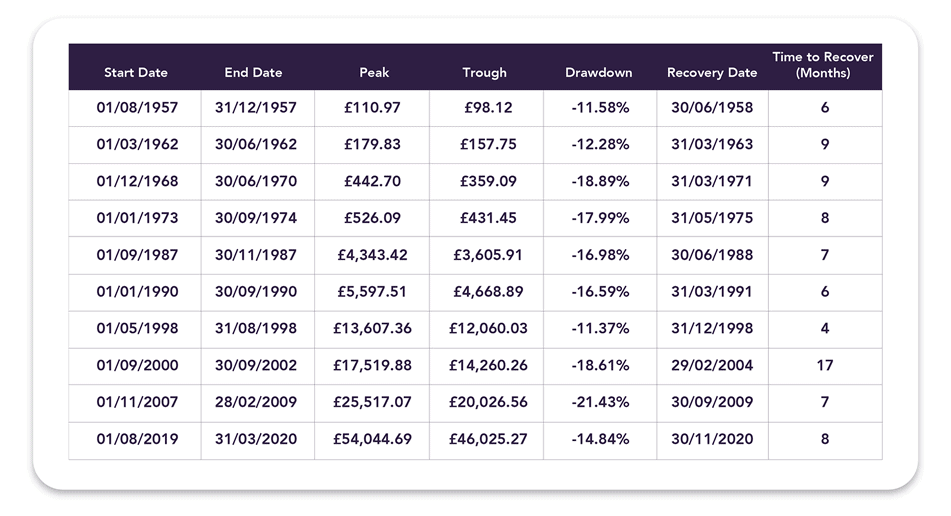
The first thing to note is that a quick look at the start and end dates for these corrections shows that they are relatively close together. In fact, on only one occasion did the correction stretch out beyond two years (and even then by only another month. They are more like the rain in Florida – sudden, relentless and short-lived, than the rain in England – persistent, and seemingly omnipresent.)
On its own, though, this fact would be of little use to us if the market then capitulated and traded sideways for several years within a narrow range. The last column (time to recover) shows us that this is not the case, however. This is the time in months for us to get back to our previous peak (the so-called ‘high water mark’). Again, with one exception, the time taken to recoup our drawdown losses is in the single digits, with the outlier case being a little under a year and a half.
Armed with that knowledge – that drawdowns are relatively commonplace, short-lived, and subject to swift resumption of the long-term bull scenario – we can go about our investing safe in the knowledge that we need not seek to time the market, tweak our allocation, or otherwise deviate from the tried and true course we have set to get us to our destination. We could even fall asleep for a year and be no worse off. – just ask our Global 60 Rip van Winkle investor, as he counts the 3.54% return he made in 2020, despite it being quite possibly the worst year that any of us (who didn’t sleep through it) have endured.
If you have a question relating to this article, please get in touch.