
Market falls during the year do not always lead to poor annual returns
For many UK investors over the age of 55, one of the biggest challenges in investing is not choosing a fund or selecting an ISA provider. It is staying calm when markets fall.
A portfolio drop of 10% or more can feel deeply uncomfortable, especially when retirement is approaching or income withdrawals have already started. But the data in the chart below offers an important perspective. It shows that although global stock markets often experience meaningful falls during the year, they have still frequently gone on to finish the year with a positive return.
That distinction matters. A temporary fall is not necessarily the same as a permanent loss, provided the investment remains suitable and the investor is not forced to sell at the wrong time, and it is certainly not always a sign that an investment plan has failed.
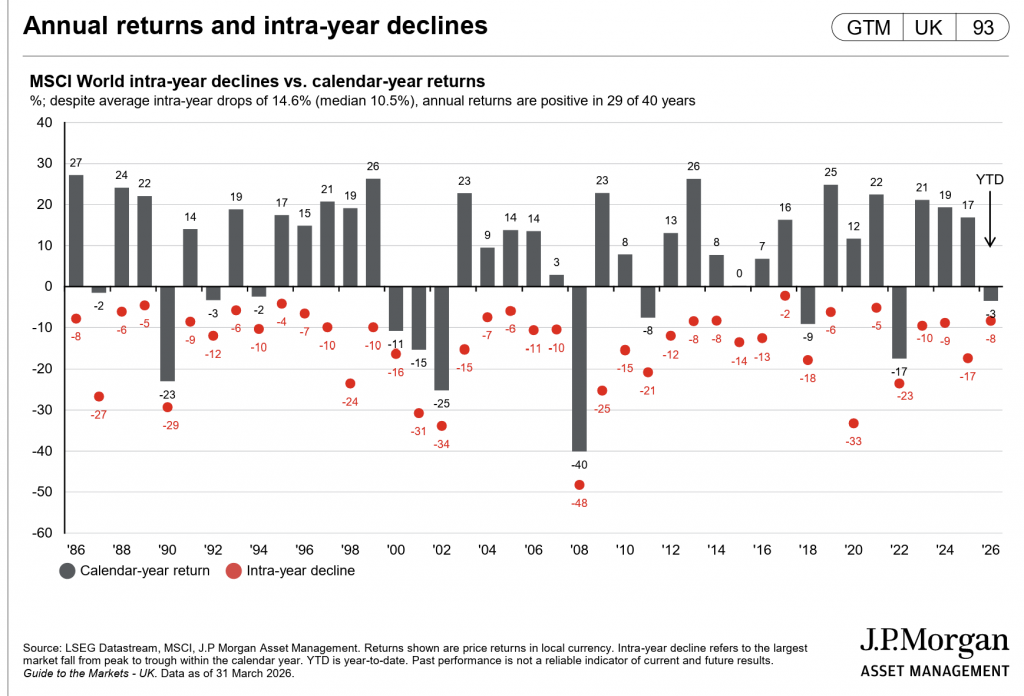
Source: J.P. Morgan Asset Management Guide to the Markets, using LSEG Datastream and MSCI data. Data as of 31 March 2026. Returns shown are price returns in local currency.
What data is being used here?
The chart is based on the MSCI World Index, which is one of the best-known measures of developed global stock markets.
In simple terms, the MSCI World Index tracks a broad range of large and medium-sized companies across developed countries. It includes major markets such as the United States, Japan, the UK, France, Canada, Switzerland and Australia. It is designed to represent a large share of the investable developed-world equity market.
A few important points are worth noting.
The MSCI World Index is:
- A share index
- Focused on developed markets
- Heavily influenced by the US market
- Not a multi-asset portfolio
- Not a pension fund
- Not a balanced retirement strategy
It does not include bonds, cash or direct exposure to emerging markets. So when we look at this chart, we are looking at the behaviour of a broad developed-market equity index, not the behaviour of a typical cautious or balanced retirement portfolio.
That is an important distinction for UK retail investors, because many people over 55 are not invested 100% in global shares.
What is the chart actually telling us?
The most important message is this: temporary declines during the year are normal, even in years that end positively.
According to the data shown, the MSCI World Index experienced an average intra-year decline of 14.6%, with a median intra-year decline of 10.5%. Yet despite those falls, annual returns were positive in 29 of the 40 years shown.
That is a striking result.
Many investors assume that if markets fall sharply during the year, the year is likely to end badly. The chart shows that this is often not the case. Markets can be uncomfortable, volatile and even alarming in the short term, while still delivering a positive outcome by the end of the calendar year.
What is an intra-year decline?
This phrase sounds technical, but the idea is straightforward.
An intra-year decline is the largest drop from a market high point to a low point within the same calendar year.
For example, imagine a market starts the year well, then falls 12% in the spring, before recovering and ending the year up 8%. The intra-year decline would still be 12%, even though the year-end result was positive.
That is why this chart is so useful. It captures both:
- The worst point investors may have experienced emotionally during the year
- The calendar-year return the index recorded
This is particularly relevant for investors approaching retirement, because emotional reactions often happen at the worst possible time. A decline in the middle of the year can feel like confirmation that risk has become too great, even though the eventual annual outcome may prove much better than feared.
Why this matters for investors over 55
For investors in their late 50s, 60s and beyond, market falls often feel more personal than they did in earlier years.
At 35, a market setback may seem inconvenient but distant. At 60 or 70, the same fall can feel like a direct threat to retirement plans, pension withdrawals or long-term financial security.
That is why it is so important to separate short-term volatility from long-term investment failure.
The chart does not suggest that markets always recover quickly, nor does it suggest that losses do not matter. Clearly, there are years in which the market falls sharply and finishes down. 2008 is the most obvious example in the data. But what it does show is that short-term falls are part of normal market behaviour, not proof that a long-term strategy is broken.
Most investors are not 100% invested in global equities
This is perhaps the most important practical point for UK retail investors.
Many people will look at a chart like this and worry that their pension or ISA could fall by the same amount. In reality, many investors over 55 are not fully invested in something like the MSCI World Index.
Instead, they often hold a multi-asset portfolio made up of:
- Global shares
- Bonds
- Cash
- Sometimes property or infrastructure exposure
A typical 60/40 multi-asset fund holds around 60% in equities and 40% in bonds, rather than being fully invested in shares.
That does not make it risk free. A 60/40 style portfolio can still fall, and in some market environments it can fall meaningfully. But in broad terms, you would usually expect a fund like this to experience smaller intra-year declines than a 100% equity index such as MSCI World.
A diversified multi-asset portfolio may experience smaller falls than a 100% equity index, although this is not guaranteed and will depend on the portfolio, market conditions, charges and any withdrawals being taken.
Why this comparison matters
For retirement investors, the goal is not simply to maximise returns. It is to build a portfolio that is both financially sensible and emotionally manageable.
That is where balanced funds can play an important role.
A 100% equity approach may offer stronger long-term growth potential, but it also comes with deeper and more frequent swings. For some investors, especially those drawing income, those swings can be difficult to live with.
A mixed portfolio may reduce some of the long-term upside, but it can also reduce the severity of downturns and make it easier to stay invested through difficult periods.
That behavioural benefit is often underestimated.
A portfolio is only effective if you can stick with it. If market falls cause repeated anxiety or lead to panic-selling, then even a theoretically “better” investment strategy may be the wrong one in practice.
The real lesson from the chart
The chart is not telling investors to ignore risk. Nor is it saying that all market falls should be dismissed as noise.
What it is showing is something more useful:
- Market setbacks are common
- Sharp falls within a year are normal
- Positive full-year returns can still happen despite those falls
- Patience and perspective often matter as much as fund selection
For investors over 55, this is a valuable reminder that a well-built portfolio should be designed not only for growth, but also for resilience. That resilience may come from diversification, from holding bonds alongside shares, from keeping adequate cash reserves, or from simply understanding that volatility is part of the investment journey.
A final thought
The MSCI World data is a helpful reality check. It reminds us that investing is rarely a smooth upward line. Even strong years often contain uncomfortable periods.
For UK retail investors approaching or living in retirement, that is not a reason to avoid markets altogether. It is a reason to make sure your portfolio reflects your actual needs, your time horizon and your tolerance for short-term falls.
If you are invested in a balanced portfolio rather than 100% in global equities, the principle still holds: temporary declines are part of investing, and they do not automatically lead to poor outcomes.
The aim is not to avoid every fall. The aim is to own a portfolio you understand, can live with, and can stick with when markets inevitably become unsettled.
If you have a question about your investments, then please get in touch via the form below or call us on 01825 76 33 66.