
What does a century of economic cycles teach investors about investing?
Markets around the world have often rewarded investors even when economic activity has slowed. This is an important lesson on the forward looking nature of markets, highlighting how current market prices reflect market participants’ collective expectations for the future.
Click on the image to take a look at the fascinating interactive download, which demonstrates how stocks have behaved through the US economic downturns, which were all due to global events.
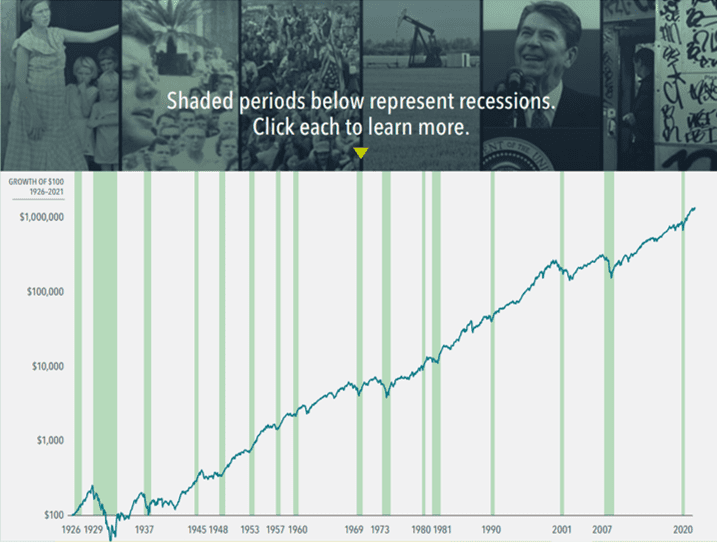
You’ll see on the graphs the downturns during the periods below, but note the stock market recovery after each.
- 1926 – 1927 – Mild yearlong recession
- 1930 – 1934 – Great Depression
- 1937 – 1938 – Short sharp recession
- 1945 – 1945 – World War II recession
- 1948 – 1949 – Post war
- 1953 – 1954 – Korean Armistice
- 1957 – 1958 – Mid 1950s boom blip
- 1960 – 1961 – 4 months dip post bull market
- 1969 – 1970 – High inflation and unemployment
- 1973 – 1975 – Oil Crisis
- 1980 – 1980 – 6 month decline
- 1981 – 1982 – 16 months recession
- 1990 – 1990 – Gulf War
- 2001 – 2001 – Tech boom and bust
- 2007 – 2009 – Global Financial Crisis (16 months)
- 2020 – 2020 – Covid-19 (2 months)
If you are concerned about your investments or have any questions, please get in touch via the form below or call us on 01825 763366.