Found in a church in France.
“When you enter this church it may be possible you’ll hear God’s call. It’s unlikely He will call you on your mobile. Thank you for turning off your phones… If you want to see God, send Him a text while driving.”
About a month ago, Citywire did the second of its annual reports on St James’ Place (SJP), looking at the fees charged and returns generated by its suite of 36 funds; the headline is that SJP earned nearly 4 times more than the fund managers they employ to actually invest the money.
But is this an issue?
If fund managers are so desperate for Assets Under Management (AUM) that they are prepared to accept this state of affairs, is this not a contractual arrangement that they have entered into voluntarily and is their decision?
More concerning is the level of fees charged to clients and the effect this inevitably has on investor returns. So, we thought it might be time to peruse this more closely.
It appears that there are some very high hurdles to overcome.
SJP is a giant amongst asset/wealth managers with c.£100 billion in AUM and has a range of 36 unit trusts it offers to clients.
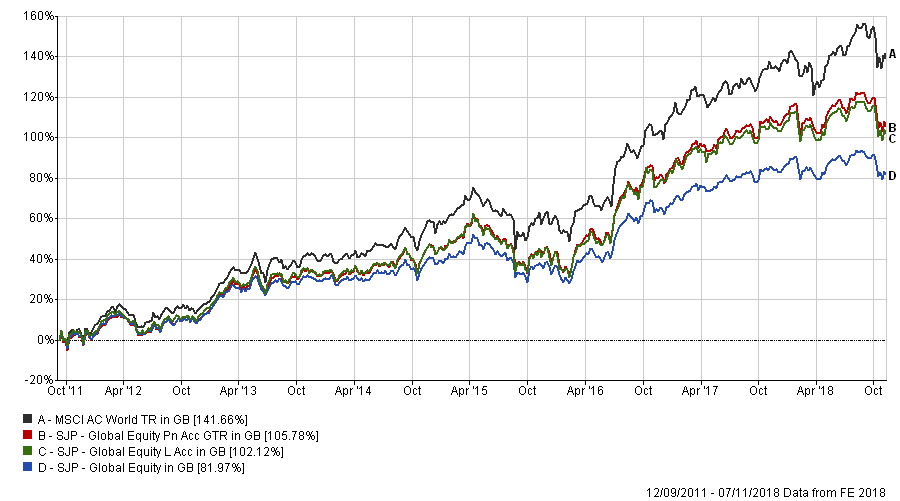
It uses its size to negotiate very lucrative deals with fund managers (as above); charges are extremely high at around 1.81% per annum [1], (which purports to cover administration and client reporting fees in addition to the normal Ongoing Charges Figure (OCF)-related charges). There is also an initial 5% up-front fee (to cover, SJP says, the costs of setting up the investment and the initial advice), in addition to the OCF, which is calculated on a daily basis – as is the norm. As can be seen below, the comparison Benchmark (the MSCI AC World Index) has trounced the SJP funds. So far, so bad.

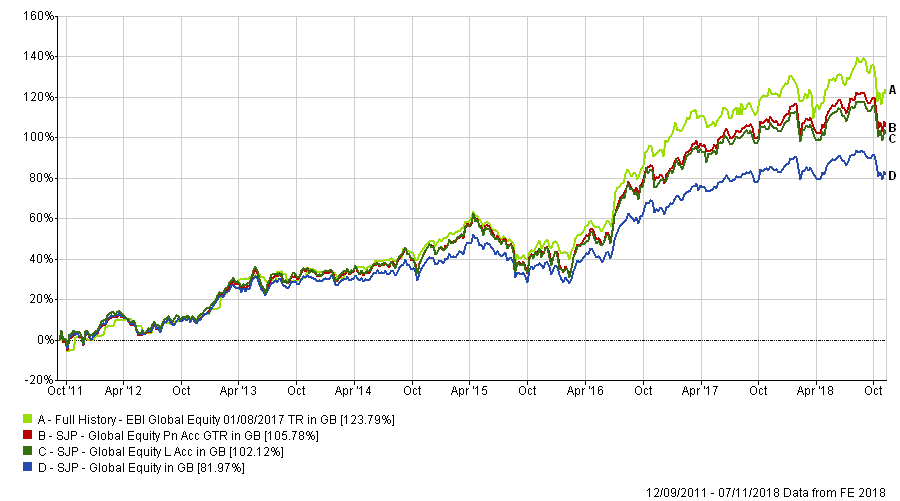
Comparisons with our model portfolios are not easy since SJP funds tend to invest by region (or asset class) but there are a few Global Equity funds which we can compare vis-a-vis our model (EBI 100), which we do next (below).
Here we see that (not surprisingly), EBI 100 has beaten the best-returning SJP fund by 1.18% per annum over this time [2] and by 2.93% per annum against the worst of the three. In the last 3 years, return differentials have widened such that EBI 100 has beaten the best-performing fund by 1.77% p.a. and the worst by 4.34% per annum.

Let’s lower the bar a little
If we assume a 1.2% charge for EBI 100 (far higher than the current cost), what would the returns look like then? Annualised returns (currently 11.90% p.a. net and 12.25% gross of charges) would become 11.05% per annum, giving an overall return of 111.94%, leaving EBI still ahead of (the best) SJP fund by 0.41% per annum.
Thus, this new (theoretical) charge rate takes 11.85 percentage points off total returns; alternatively, using the best-performing SJP fund (above), we can calculate an annualised return of 10.59% (and 12.4% p.a. gross of fees). Dividing 1.81 by the gross return implies that SJP is taking 14.6% of the total portfolio return in charges, with no risk to themselves!
So, returns before fees are more or less the same, but the end-investor sees relatively little of the net return, which is the problem Investors face in Active investing in all its forms; all of this underscores the importance of costs as a determinant of future returns- it certainly appears that costs ARE being driven down, but not for the benefit of clients (and as the article says, around two thirds of the initial 5% charge goes to the SJP Partner involved in the setting up of the account [2])- this is hidden to a large extent in the “bundling” of fees into one number that obfuscates the amount the client is being charged (and for what).
It may be a good idea to amalgamate all charges in one fee (provided it is and can be appropriately broken down on request) and if ALL fund management houses were to do the same, meaningful comparisons could be made. But this is not at all likely in the short/medium term and assumes all investors are doing so directly (i.e. without advisors or the need for platforms), which of course is not realistic.
Why no sustained outrage about the charges (and subsequent performance)?
The article concludes by suggesting that some (or most) of SJP’s clients are happy with this arrangement (“There are high-flying professionals, including people from within the investment world, who use SJP for their advice and investment and are very happy with it”).
Let the buyer beware
But what does it say about the state of the “investment world” when even those in it are not remotely interested in the costs THEY are charged? If they are not willing to challenge these costs for themselves, it is forlorn to expect them to do so for their customers – caveat emptor.
Notes:
[1] On page 7 of the Citywire publication, an SJP spokesman pointed out that fund returns are often pre-platform and advisory fees, (which is true); he believes this could “reduce the stated performance of these funds by around 0.75% to 1% each year for advised investors”, which still means that EBI has outperformed, as our calculations confirm.
[2] Assume £1,000 is invested via SJP. A net return of 5% per annum for 5 years gives a total portfolio value of £1,276.28, but only £1,212.47 once the 5% initial charge is taken into account (as the initial investment of £1000 is reduced to £950 by the 5% up-front fee) – the investor needs a return of 6.08% p.a. to offset this (reduced) initial investment.
